By default, European patents granted by the European Patent Office (EPO) in effect in countries participating in the Unified Patent Court (UPC) are subject to the jurisdiction of that Court. However, patent proprietors have the option to opt their European patents out from the UPC’s jurisdiction. Such opt-outs are defensive in nature as an opt-out protects a European patent from being revoked in a single court action. Opted-out patents can only be revoked in national proceedings brought on a country-by-country basis.
Given the defensive nature of UPC opt-outs, it would be expected that one factor which patent proprietors will consider when deciding whether to opt patents out of the jurisdiction of the UPC would be the likelihood of revocation actions being brought against their patents. EPO oppositions are by far the most common form of revocation action which are brought in Europe. Hence, EPO opposition rates should provide a reasonable indication of the rate at which revocation actions are sought against patents in different technologies. With that in mind, it would be expected that in general there might be a correlation between EPO opposition rates and opt-out rates in different technologies. But is that really the case?
Differences in opt-out rate vs EPO opposition rate across technical fields
The figure below shows the opt-out rate vs. EPO opposition rate for the different technology fields for which the EPO grants patents apart from food chemistry which has been omitted in the interests of clarity due to the exceptionally high rates of opposition filed against Food Chemistry patents.
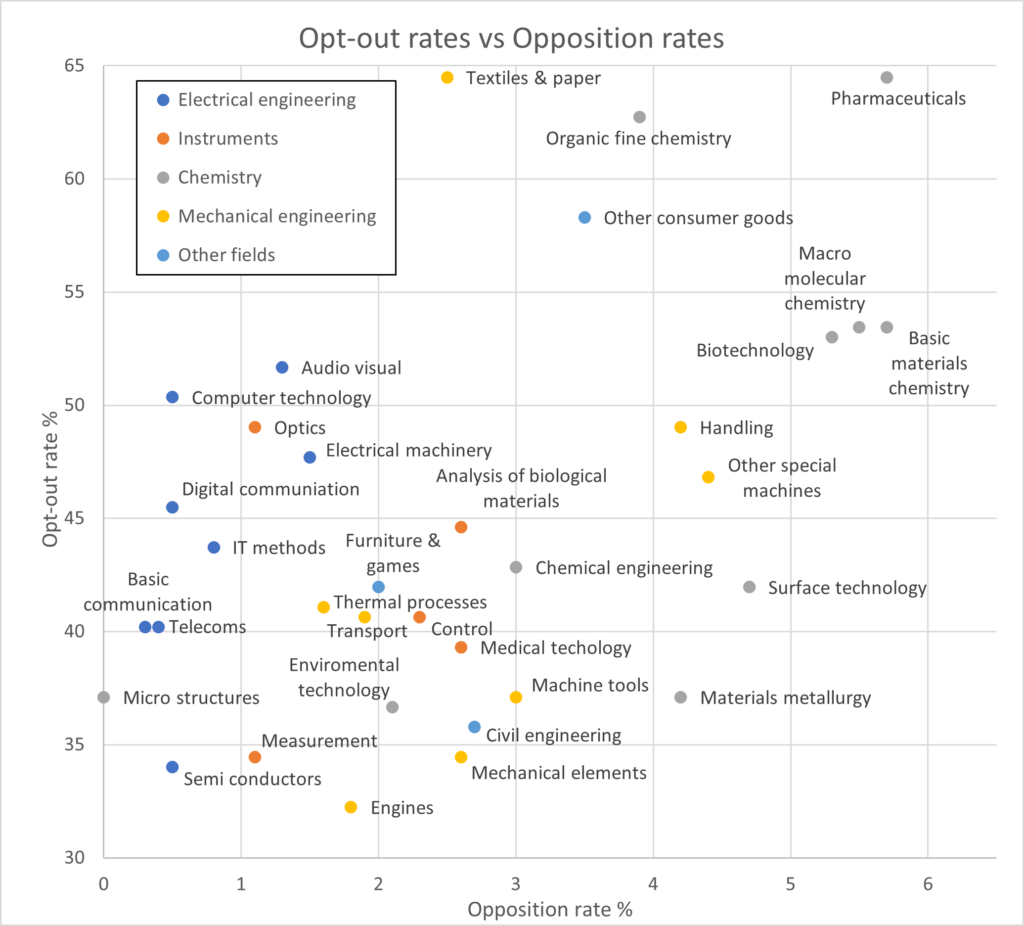
As can be seen in the graph above, there is relatively little correlation between opt-out rates and opposition rates across technologies as a whole. However, a glance at the graph does demonstrate that there are very few technologies associated with high-opt out rates which are associated with low opposition rates and vice versa.
Part of the problem with considering opt-out and opposition rates across all technologies is that opposition rates vary considerably across technical fields. For that reason, it is worthwhile drilling down and considering patents in related technical fields.
Assessing opt-out rates and opposition rates in electrical engineering fields
The following graph illustrates opt-out rates and opposition rates, but this time only considering technologies in electrical engineering.
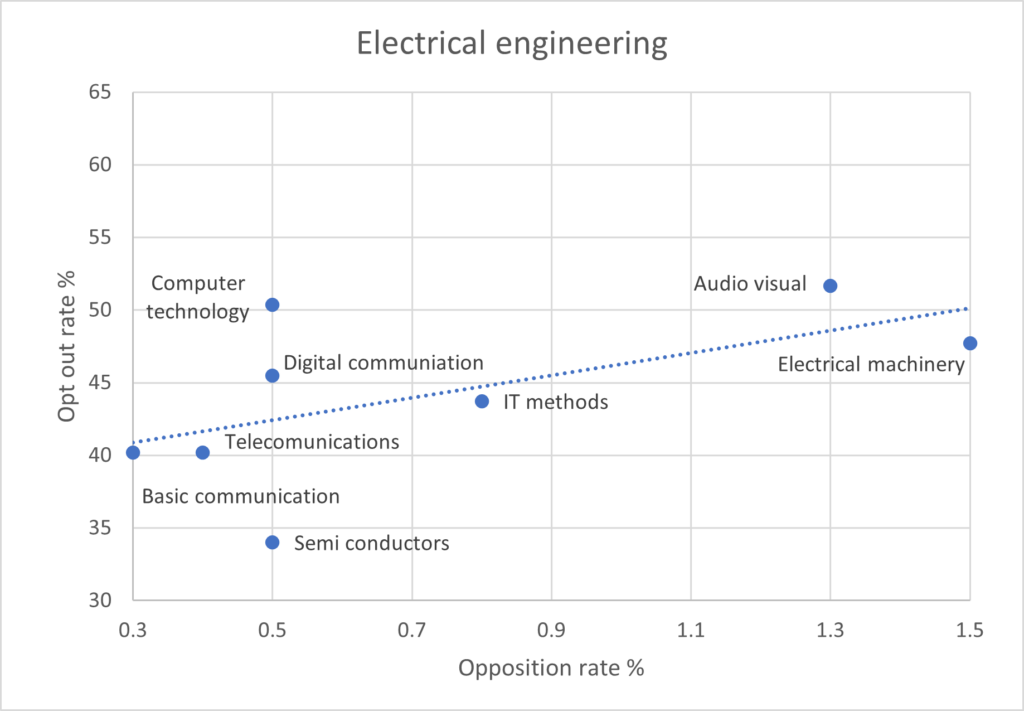
When only electrical engineering patents are considered, then a much stronger trend appears with a significant proportion of variation of opt-outs across different fields being correlated with EPO opposition rates. As a whole, across electrical engineering technologies, differences in opposition rate account for around a third of the variation of opt-out rates. As can be seen from the graph above, most of the remaining variation is accounted for by the relatively high opt-out rate of computer technology patents compared with the numbers of oppositions filed against such patents and the relatively low opt-out rate of semi-conductor patents.
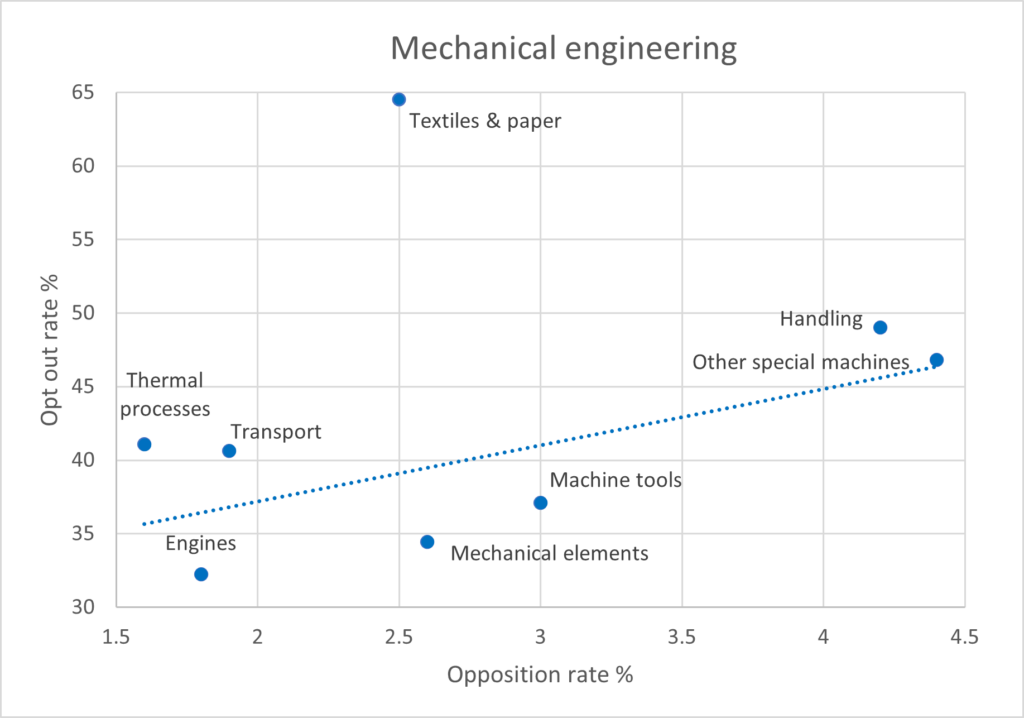
Comparable patterns in patents related to mechanical engineering
Similar trends can also be observed with mechanical engineering patents, with one obvious clear exception, namely patents in the field of textiles and paper, which have opt-out rates far in excess of what might be expected given the relatively low numbers of oppositions which are filed against such patents. In the graph below, the trendline for mechanical engineering patents other than in the field of textiles and paper is shown. If textiles and paper inventions are excluded, the variation in opposition rates accounts for around half of the variation in opt-out rates across mechanical engineering technologies.
More variation in chemical technology fields
Significantly more variation is to be found in chemical technologies, illustrated in the graph below. Food chemistry has been included in this graph as the higher rates of opposition in chemical technologies as a whole mean that the inclusion of food chemistry with its very high rates of opposition does not cause the opposition rates for other technologies to cluster as would have done in the first figure.
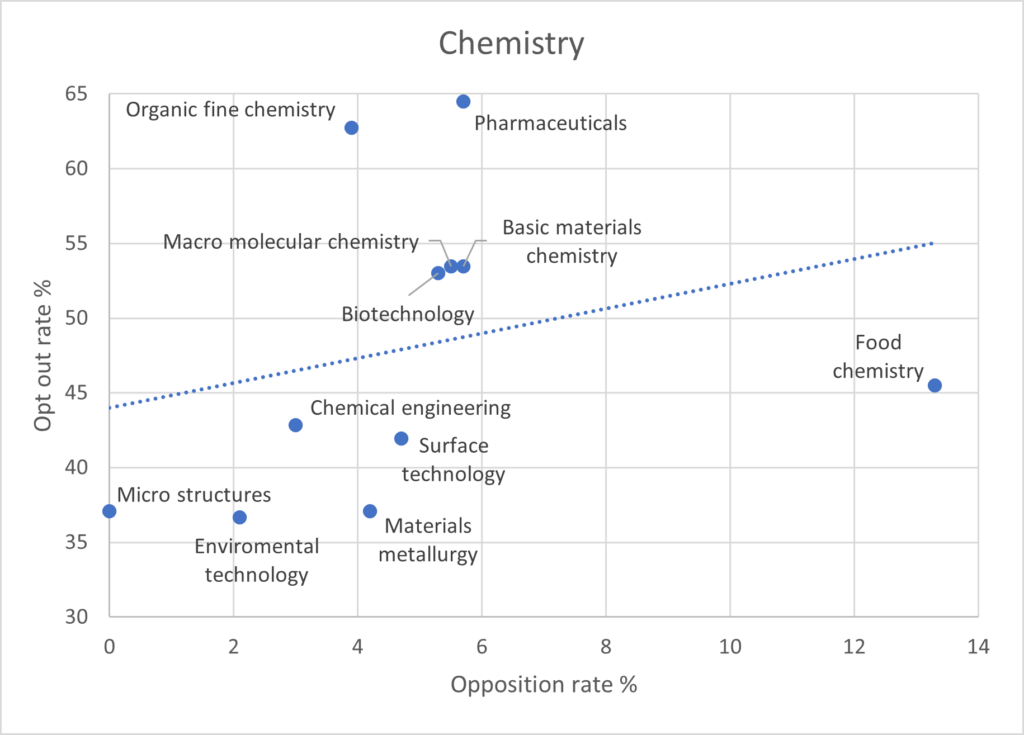
As can be seen in this graph, there is practically no correlation between opt-out rates and opposition rates across chemical technologies, with variation in opposition rates explaining only around 7.5% of the variation in opt-out rates in chemical fields. This suggests that factors, other than the actual likelihood of revocation actions being brought, are the primary factors behind the variation in opt-out rates in different fields of chemistry. Most likely, the significant value of some chemical patents, particularly those in the pharmaceutical field, results in extra caution on the part of patent proprietors in certain fields where the risk of a revocation action is not insignificant, and the potential commercial impact of the loss of individual patents can be very large.
Conclusions
Proprietors’ assessment of the risk of revocation is clearly only one of many factors which proprietors consider when deciding whether to opt their patents out of the jurisdiction of the UPC. The costs involved in filing and registering UPC opt-outs are limited and as a result significant numbers of European patents have been opted-out. If the risk of central revocation is a significant one, it would be expected that patent proprietors are well placed to identify patents which are at risk. However, other factors are clearly of importance and the extent to which out-opts have been risk-based has varied considerably across different technological fields.